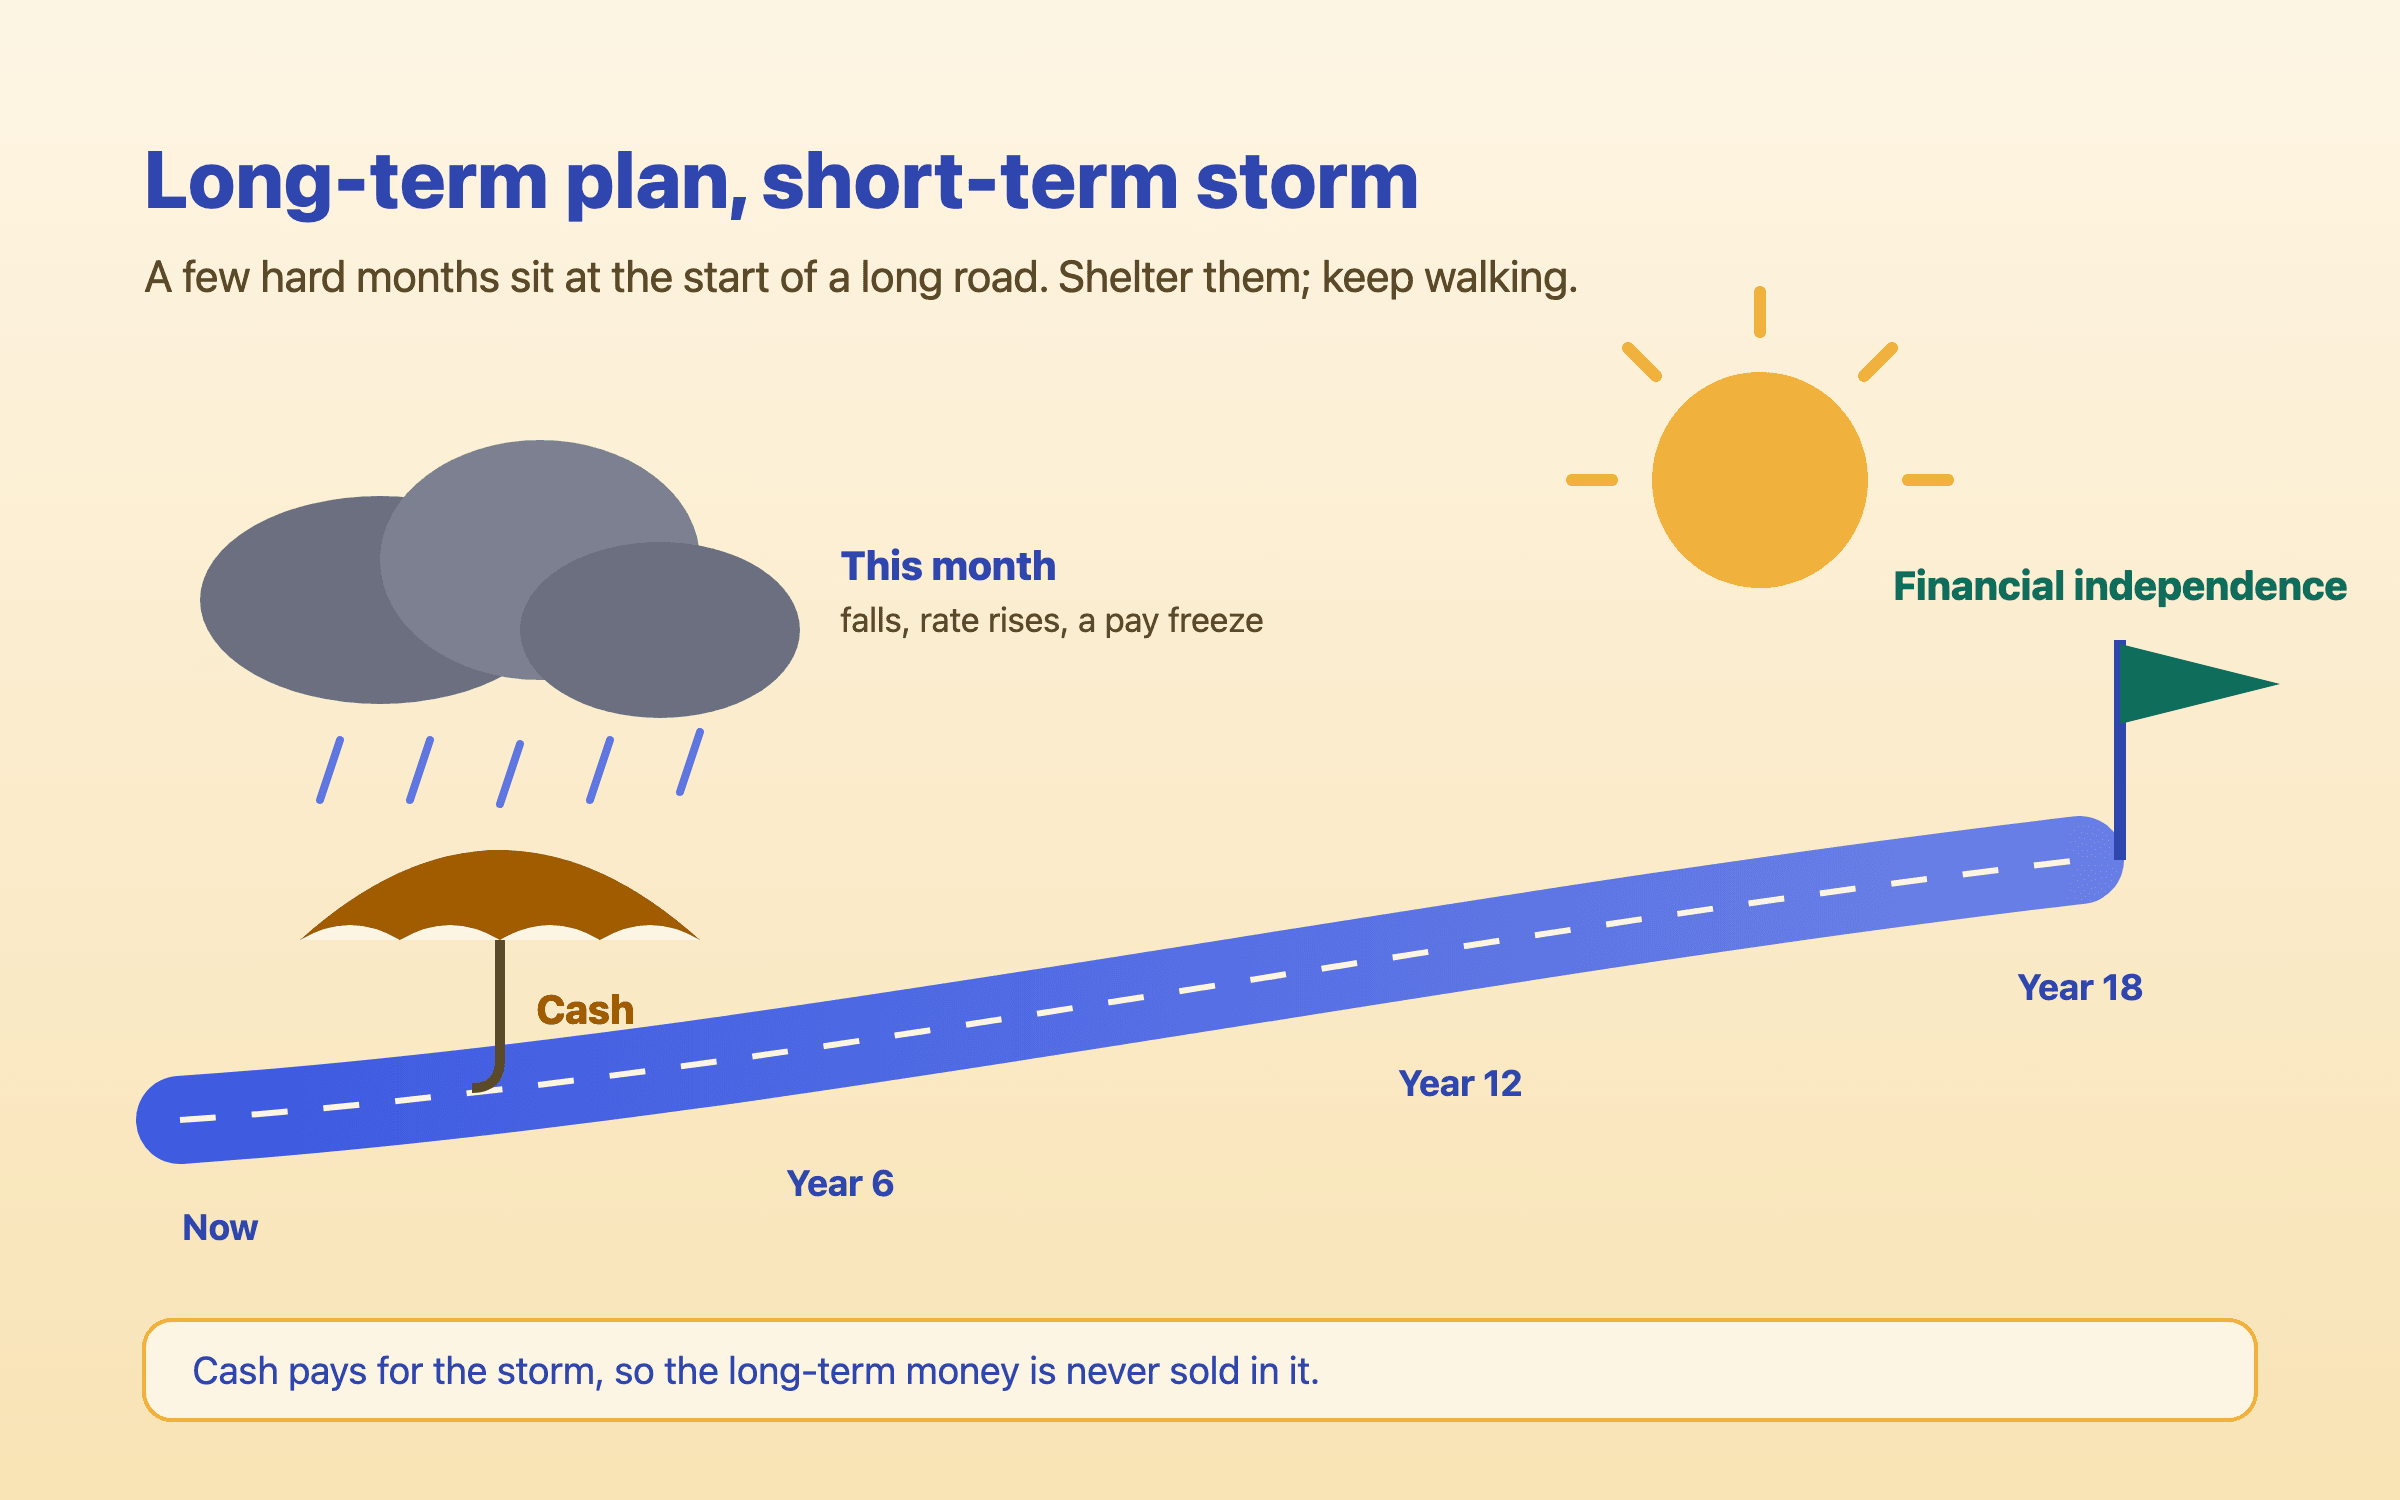
A six-month pause in a SIP costs an 18-year plan about four months; stopping for good costs about seven years. For many households the order is: protect the present, then keep the long money invested.
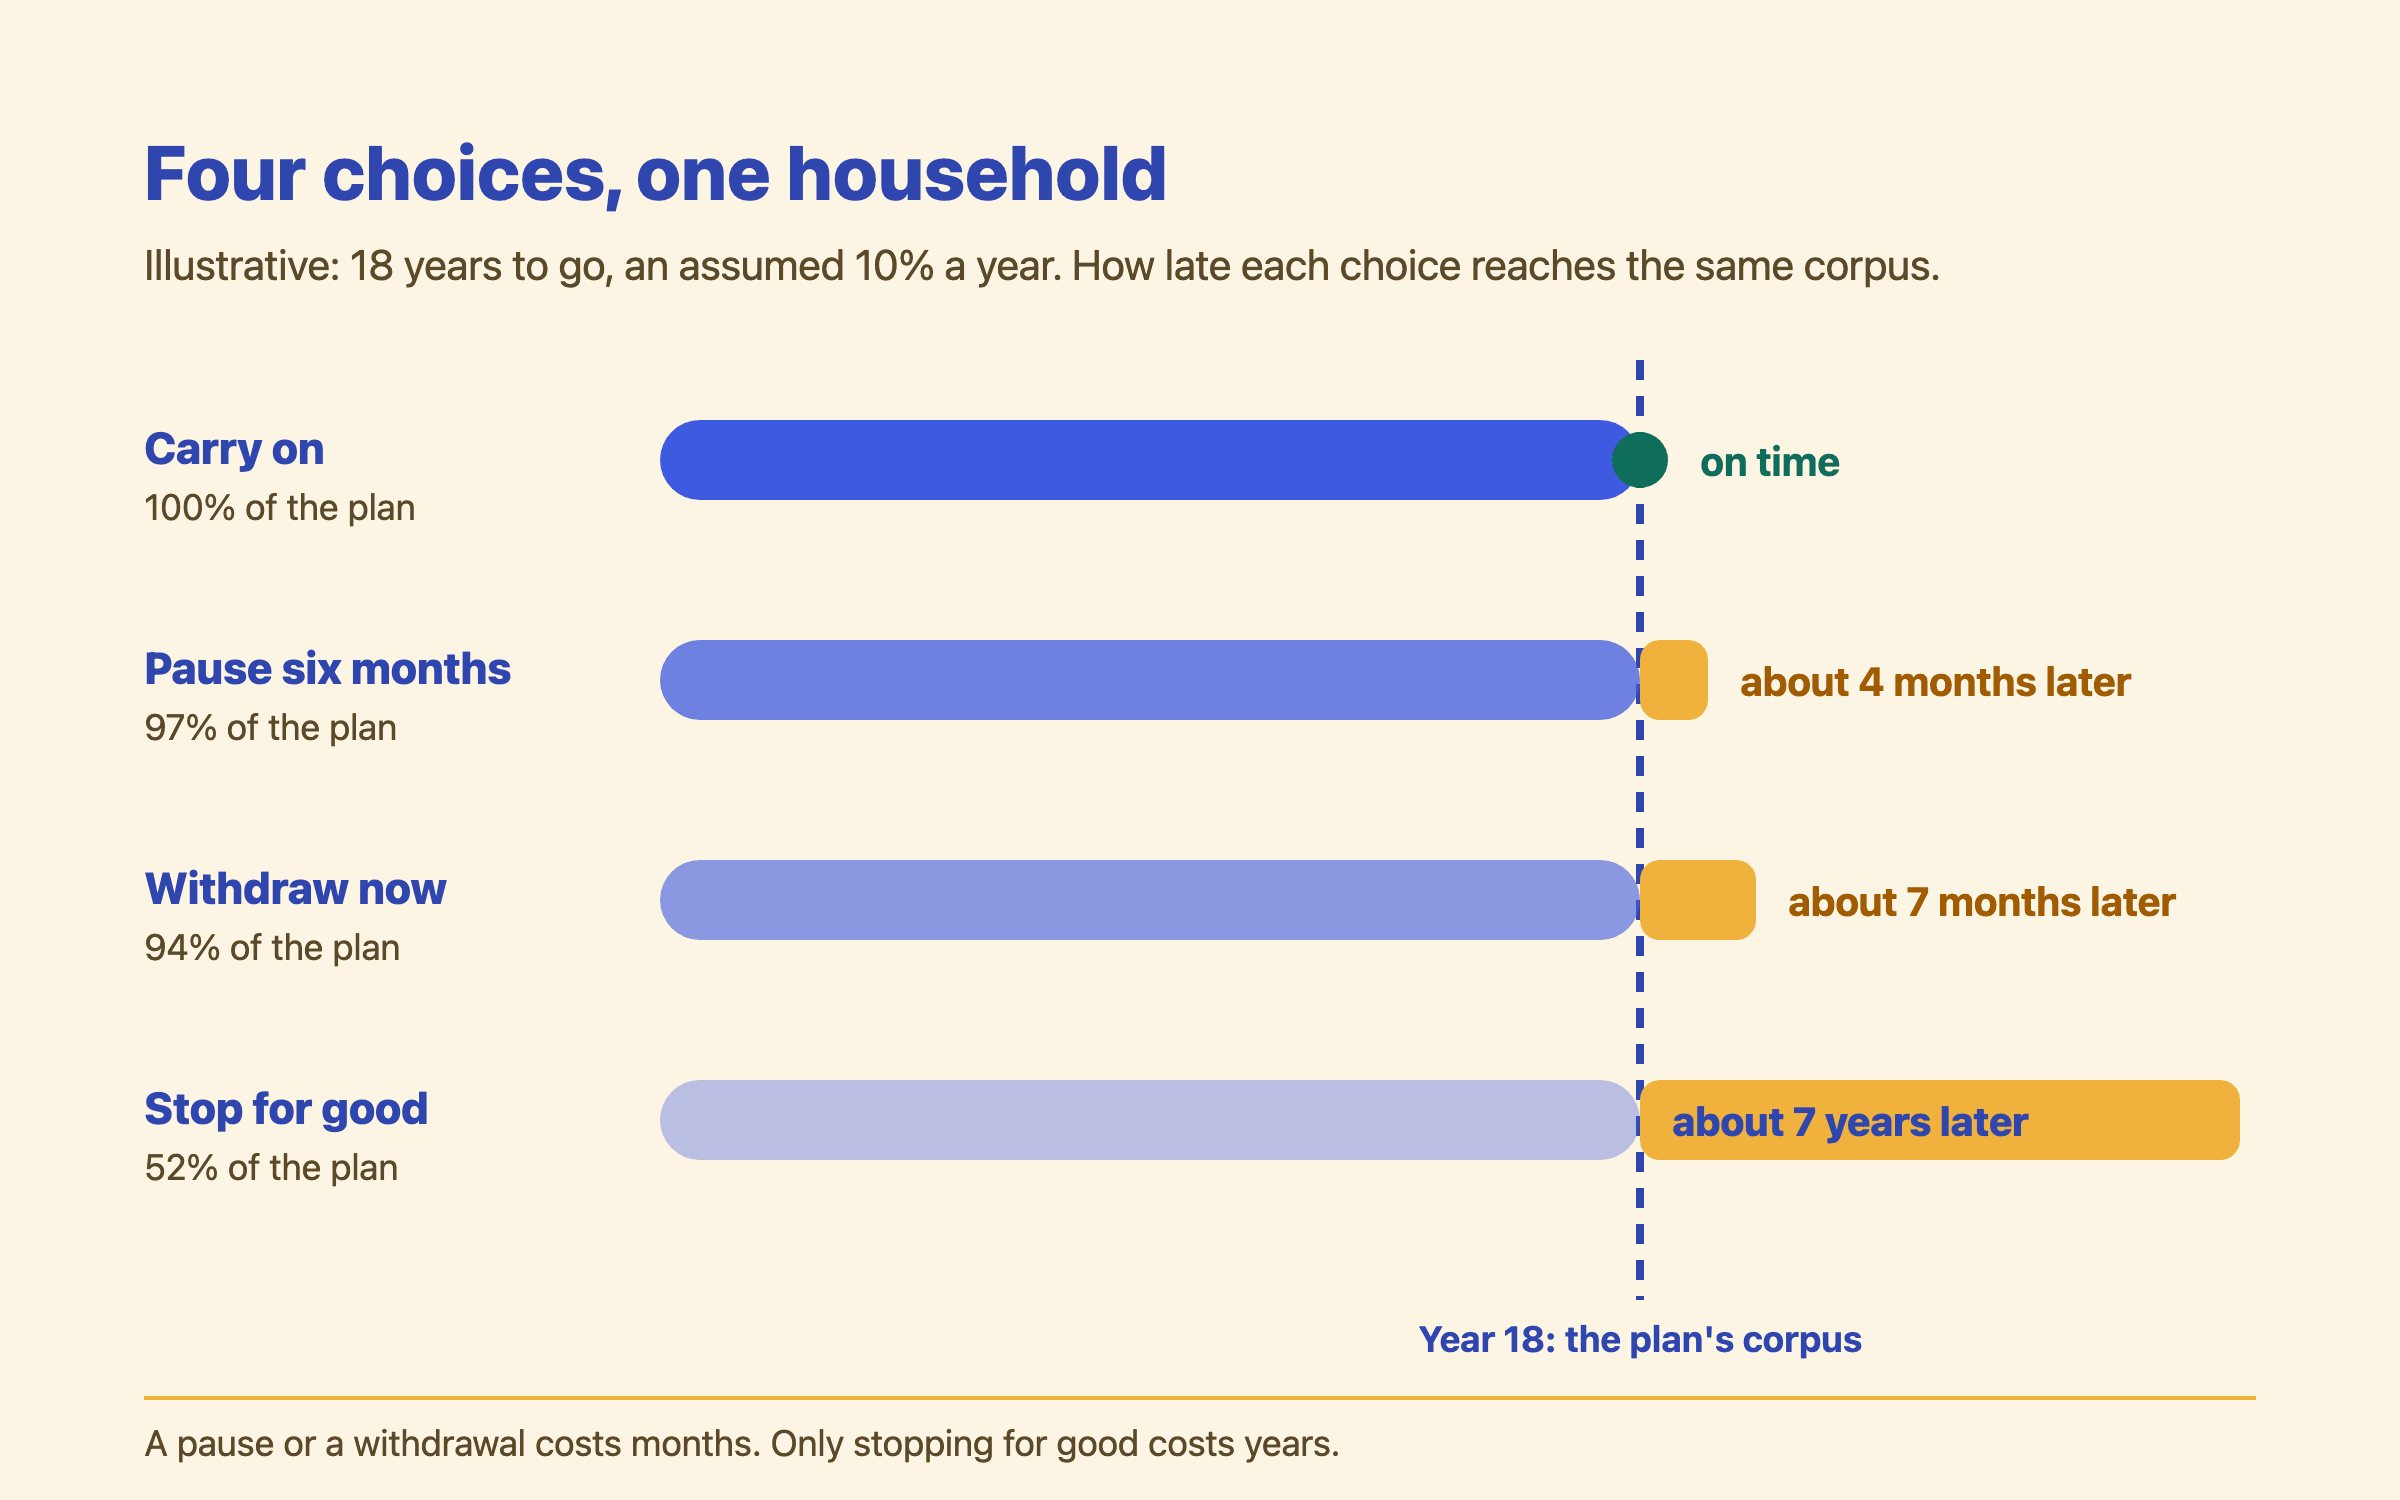
In a bad month the choice feels like all or nothing, and it is not. For an illustrative Delhi couple with 18 years to go, pausing a ₹40,000 SIP for six months leaves 97% of the plan and delays it about four months, while stopping for good leaves 52%. The pause is often the right call if it buys the cash that keeps long-term money from being sold in a fall.
Nivritee Research · 31 October 2026 · 10 min read
The short answer: a hard month is a reason to protect this year, not to tear up the next eighteen. In the worked example below, a couple who pause a ₹40,000 monthly SIP for six months end with 97% of the corpus their plan projected, about four months late; if they stop for good they end with 52% of it, and need about seven more years to catch up1. What decides the right move is how much cash stands between the household and a forced sale, and whether anything about the plan itself has changed, not what the market did this week.
US consumer prices over the year to September 2026
Neha and Kabir live in Delhi with their nine-year-old daughter. They are illustrative, and so are their round figures: ₹45 lakh in equity mutual funds, a SIP of ₹40,000 a month, and a plan that has them financially independent in 18 years. In September alone about 63 lakh new SIPs were registered in India2; theirs is six years old. In the first week of October Kabir’s company told staff that raises were frozen until April. Neha opened the fund app at two in the morning, saw that the portfolio was lower than it had been in March, and typed “stop SIP” into the search box. She did not press the button. This article is what they worked out instead.
What the month actually looked like
It is worth naming the storm precisely, because a vague fear always feels bigger than a list. In India the Nifty 50 fell 6.06% in September 2026, from 24,080.40 on 31 August to 22,620.45 on 30 September, while Brent crude futures rose 8.33% to $98.03 a barrel4. On 7 October the Reserve Bank of India raised the repo rate by a quarter point to 5.50% and moved its stance to “calibrated tightening”; the committee’s minutes point to sharp swings in crude oil linked to the conflict in West Asia, and project consumer inflation of 5.2% for 2026-276. A floating-rate home loan tends to get dearer after a decision like that, and a fixed deposit tends to pay a little more, though banks pass rate changes on with a lag.
In the US the Federal Reserve raised its target range by a quarter point to 3.75–4% on 16 September, unanimously7. On 28 October it held there, by ten votes to two; the two dissenters, Lisa Cook and Beth Hammack, wanted another rise, and the statement said plainly that inflation “remains elevated”8. Consumer prices were 3.7% higher in September than a year before, with gasoline up 34.2%, while prices excluding food and energy rose 2.6%5. American households felt it: the Conference Board’s confidence index fell to 84.2 in September, which the AP reported as the lowest reading since April 2014, before recovering to 91.7 in October9. Employers announced 43,281 job cuts in September, the fewest for a September since 2022, but planned hiring of 90,787 was the weakest September figure since 201110. Few people being fired and few being hired is exactly the mix that makes a pay freeze feel like a warning.
Not every central bank moved. The Bank of Thailand held its policy rate at 1.00% on 28 October, projected 2026 growth of 2.4% and expects headline inflation to average 2.1% this year11. For a Thai family the month’s pressure came through energy prices and through the dollar markets their savings may hold, rather than through a dearer loan.
Three central banks’ policy rates before and after their September and October 2026 decisions.
Before the decision, %
At 31 October 2026, %
The Fed’s rise was on 16 September and it held on 28 October; the RBI rose on 7 October; the Bank of Thailand held on 28 October. A higher rate raises floating loan payments and deposit rates; it says nothing about where markets go next. 7,8,6,11The figures in this chart
Before the decision, %
At 31 October 2026, %
US Federal Reserve (top of range)
3.75%
4.00%
Reserve Bank of India (repo)
5.25%
5.50%
Bank of Thailand
1.00%
1.00%
Here is the part of the news that helps. Indians have been through this once already in 2026. In March the Nifty fell 11.3%, and more SIPs closed or matured than were started: 53.38 lakh against 52.82 lakh new, a stoppage ratio of about 101%12. Yet the money kept coming. September’s contributions, ₹32,490 crore, were a record, up from ₹32,297 crore in August2, and the stoppage ratio fell to 78.5%, with 49.68 lakh SIPs closed or completed against 63.26 lakh registered3. That ratio counts SIPs that simply reached their end date too, so it overstates panic. Most households, in a harder month than this, carried on.
Four choices, worked through
Neha listed what they could actually do: carry on as before; pause the SIP for six months and then restart it; stop it for good; or take ₹5 lakh out now, to feel safer. To compare them fairly they need one assumed return, and 10% a year is used here as a round figure for a long run in Indian equity funds. It is an assumption, not a forecast; the point is the ordering of the choices, which holds at any reasonable rate. Every figure is in rupees of the year it arrives, 18 years from now, not in today’s money1.
Turn the yearly rate into a monthly one. 10% a year compounds to 0.797% a month, because 1.10 raised to the power 1/12 is 1.007971.
Grow what they already hold. ₹45 lakh for 18 years at 10% multiplies by 5.56, to ₹2,50,19,6281.
Grow the SIP. ₹40,000 paid at the end of each of 216 months, each payment compounding for the months left, adds up to ₹2,28,73,5241.
Add them: ₹4,78,93,152 if they carry on. That is the figure the other three are measured against1.
A pause removes six payments, ₹2,40,000 in all. Each of them had about 210 months left to grow, so together they would have become ₹12,97,916, about 5.4 times what was skipped1.
A withdrawal removes ₹5 lakh that had all 18 years to grow, so it costs 5.56 times itself: ₹27,79,959 at the end1.
Illustrative, at an assumed 10% a year compounded monthly. “Extra months” is how long each choice needs to reach the carry-on figure: with the SIP restarted and continued for the first three, and with no SIP at all for the last. 1
Choice
What they do
Corpus after 18 years
Against carrying on
Share of the plan
Extra months to catch up
Carry on
₹40,000 a month for 216 months
₹4,78,93,152
—
100%
0
Pause six months
No SIP for six months, then ₹40,000 for 210 months
₹4,65,95,236
−₹12,97,916
97.3%
4
Withdraw ₹5 lakh
₹40 lakh stays invested, the SIP carries on
₹4,51,13,193
−₹27,79,959
94.2%
7
Stop for good
No more SIP; the ₹45 lakh grows alone
₹2,50,19,628
−₹2,28,73,524
52.2%
82
The same household, four choices. A pause and a withdrawal cost months; only stopping for good costs years.
Read the table slowly, because it says two things at once. A pause is not free: ₹2,40,000 not invested now becomes ₹12,97,916 not there later1. But it is small against the whole, and it is recoverable. Restarting and simply carrying on for four extra months closes the gap; so would adding about ₹21,500 a month to the SIP for the first year after restarting, once pay moves again1. Stopping for good is a different kind of decision. It throws away the larger half of the plan, the part still to be paid in, and the money already invested would need almost seven more years to get there on its own.
How each choice builds the corpus, as a share of what carrying on reaches after 18 years.
Carry on
Pause six months
Withdraw now
Stop for good
Illustrative: the worked example at an assumed 10% a year. The pause and the withdrawal run almost beside the carry-on line all the way; stopping for good bends away and never comes back. The figures in this chart
Carry on
Pause six months
Withdraw now
Stop for good
Now
9.4%
9.4%
8.4%
9.4%
Year 3
16.0%
15.3%
14.6%
12.5%
Year 6
24.7%
23.9%
22.9%
16.6%
Year 9
36.4%
35.2%
33.9%
22.2%
Year 12
51.9%
50.4%
48.6%
29.5%
Year 15
72.5%
70.5%
68.2%
39.2%
Year 18
100.0%
97.3%
94.2%
52.2%
The pause that buys sleep
The question Neha was really asking at 2am was not about returns. It was “what if Kabir loses his job?” The answer to that lives in the savings account, not the fund. They spend ₹1,20,000 a month between them and hold ₹3 lakh in cash, which is two and a half months of spending, the low end of most guidance on how big an emergency fund should be. If Kabir’s pay stopped and Neha’s ₹70,000 carried on, the gap would be ₹50,000 a month without the SIP, or ₹90,000 with it. Announced job cuts were low in September, but so was hiring, and a low-hiring market is one where the next job takes longer to find10.
Illustrative. The pause sends six SIP payments to the savings account instead, so cash rises by six times the SIP. Months are cash divided by the monthly gap.
If this happened
Cash
Monthly gap
Months the cash lasts
Both incomes stop, cash as it is
₹3,00,000
₹1,20,000
2.5
Both incomes stop, after the six-month pause
₹5,40,000
₹1,20,000
4.5
Kabir’s pay stops, SIP carries on, cash as it is
₹3,00,000
₹90,000
3.3
Kabir’s pay stops, SIP stopped, cash as it is
₹3,00,000
₹50,000
6.0
Kabir’s pay stops, SIP stopped, after the pause
₹5,40,000
₹50,000
10.8
How many months the household’s cash lasts in each situation.
Illustrative: the household above. Six months without the SIP, parked in a savings account, takes the one-income runway from six months to almost eleven. The figures in this chart
Months of runway
Both incomes stop, cash as it is
2.5
Both incomes stop, after the pause
4.5
One pay stops, SIP carries on
3.3
One pay stops, SIP stopped
6.0
One pay stops, SIP stopped, after the pause
10.8
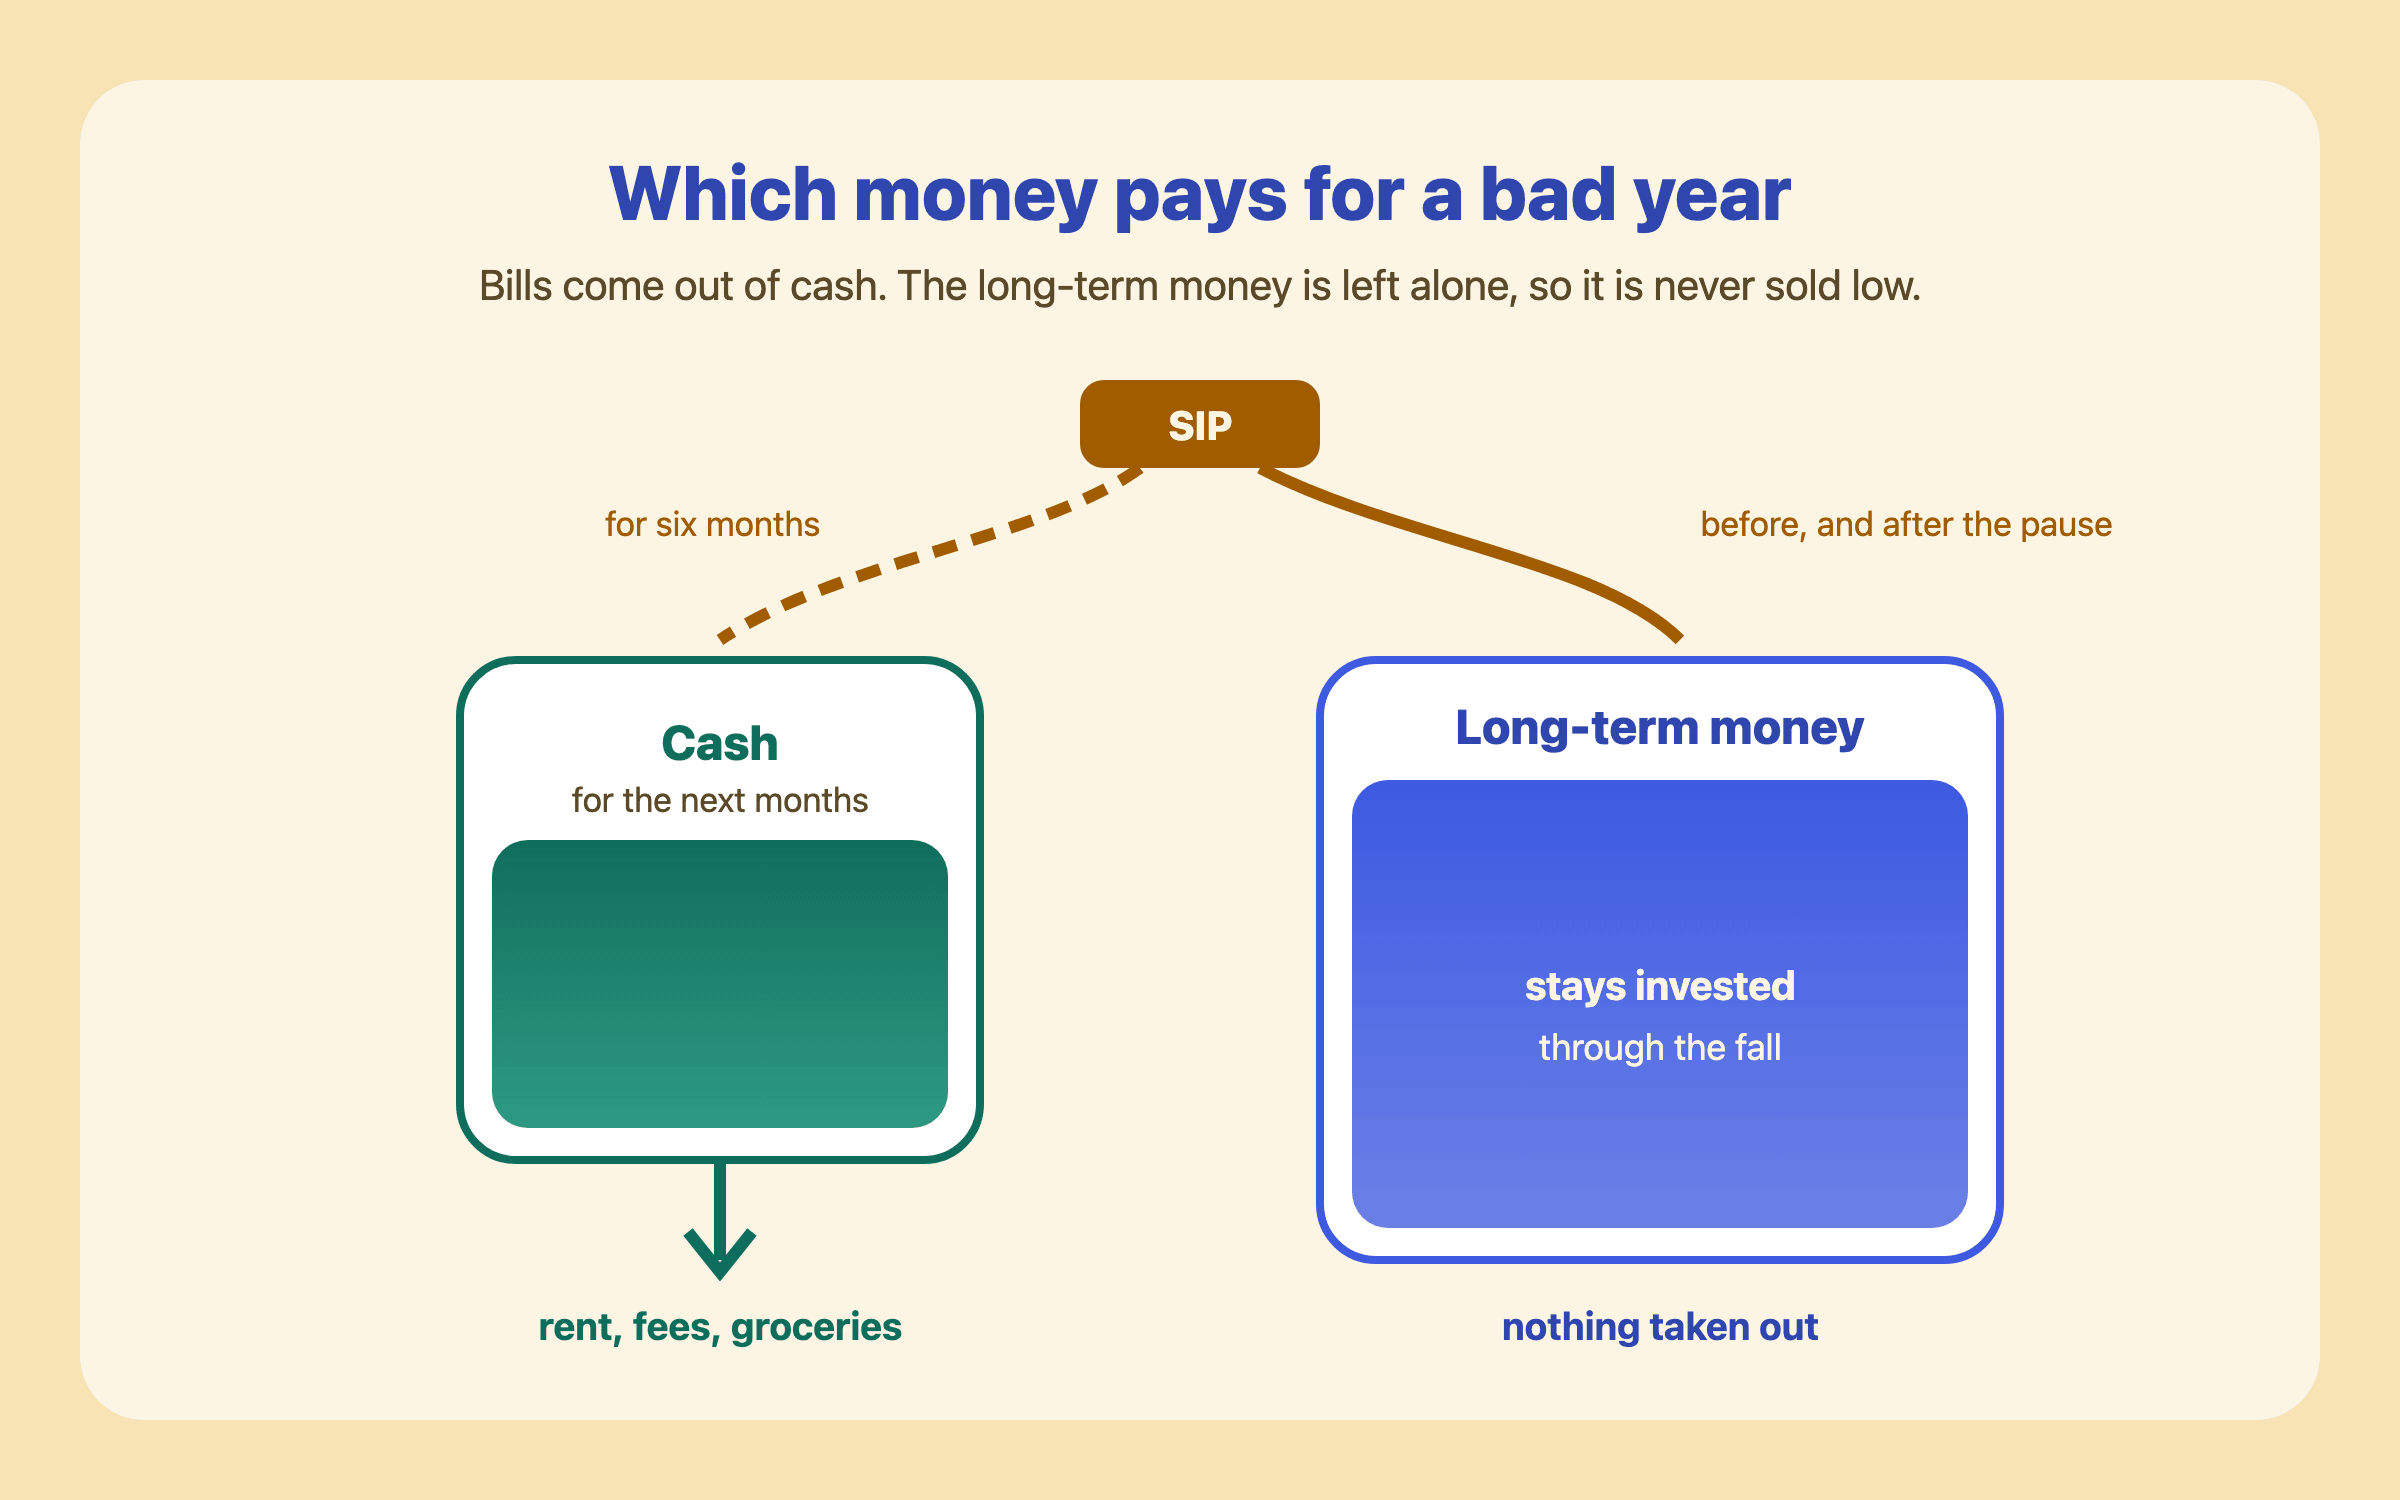
This is why a pause can be the wise choice rather than the weak one. The six skipped payments cost the plan about four months at the far end1. In exchange the household’s cash goes from two and a half months of spending to four and a half, and if one pay stopped it would last almost eleven months instead of six. That cash does a second job, too. The real damage in a fall is not the fall itself; it is having to sell units while they are down, to pay rent or fees, and so no longer owning them when prices recover. Early losses do the most harm to people who are drawing on their money, which is what sequence of returns risk means, and a forced sale in a bad year turns a working household into one of them for a while.
Bills come out of the cash. The long-term money is never the thing sold in a fall, because something else is there to be sold first.
There is a cost to the opposite mistake as well. Carrying on with the SIP while holding two and a half months of cash looks disciplined and is the riskier position: if the pay did stop, the cash would run out in a little over three months, and the first thing sold after that would be fund units, at whatever price the market happened to offer that week. Disciplined investors get hurt this way, not by pausing. Pause, fill the cash, then restart. Write the restart date down now, so the pause has an end.
Postpone a goal, do not delete it
The same logic works for goals. Neha and Kabir had pencilled in a ₹10 lakh car for next spring. Bought from the fund in a bad year, it would come out of money that had 18 years to grow, and cost the end of the plan ₹55,59,917, the same 5.56 times as any withdrawal1. Pushed back a year, if car prices rose an assumed 5% meanwhile, it would cost ₹10,50,000 and could be saved for from income once the pay freeze ends1. Postponing keeps the goal in the plan with a new date. Deleting it tends to bring it back later, as an impulse, paid for in the worst way.
Not every goal can move. Their daughter’s school fees arrive on the school’s timetable, not the market’s, and so does a parent’s hospital bill. Those are the goals to protect with cash and deposits that do not fall with shares; the flexible ones, a car, a renovation, a holiday, are the ones that give way first. Sorting goals into “fixed date” and “movable” is one evening’s work and takes most of the panic out of the next storm.
When the plan really should change
Everything above assumes the plan was sound and only the weather changed. Sometimes the ground moves instead, and then the honest thing is to change the plan, calmly and on paper. Signs that it is the plan, not the month:
Income has changed for good: a job lost and replaced at lower pay, a career break chosen, a business closed. The plan should start again from the new income.
A cost has arrived that is not going away: a parent moving in, a child’s needs, a long illness.
A loan has become expensive. When floating rates rise, a costly personal or card loan can be worth clearing before investing more; see pay off debt or invest.
The years have changed: you now want to stop work earlier or later than the plan said.
You cannot sleep with the share of your money in equities, even in normal months. That is information about the mix, not about the market, and it is better acted on in a calm month than during a fall.
What does not belong on that list: the market falling, a frightening headline, a central bank decision, or a friend selling. Those are the weather the plan was built to sail through. A useful test is to ask whether you would make the same change if markets had risen this month. If the answer is yes, it is probably a real change. If it is no, wait a month and ask again. History is mixed on how long a fall lasts, and the record of past crashes and recoveries is a better guide than any one week.
A review routine for a storm
This week: count the months of spending your cash covers, and decide whether a pause would help fill it. Write the restart date beside it.
This week: sort your goals into fixed date and movable, and move the movable ones that fall in the next year.
This week: check any floating-rate loan for a new payment after the rate decisions, and whether the bank has lengthened the term instead.
Monthly, for fifteen minutes: update balances once, at month end. Not at 2am, and not more often; checking daily turns ordinary swings into decisions.
Quarterly: ask the “would I do this if markets were up?” question of every change you are tempted to make.
Once a year, on a fixed date: rebalance if the mix has drifted, and restart or raise the SIP when pay allows.
If you already paused
Many people did. In March more SIPs closed than opened12, and some of the people behind those numbers were doing exactly what this article suggests: protecting the rent, the fees and their own sleep. A pause is not a failure of character, and it is not a judgement on whether you understand investing. It is a household deciding that this year matters too. The arithmetic says a short pause costs months, not decades1. The only expensive part is the pause that quietly becomes permanent, so the kindest thing to do for yourself is to put the restart in the calendar.
Neha and Kabir paused for six months, moved the car a year, and set a reminder for April, when Kabir’s pay review is due. Their plan now ends about four months later than it did in September. They went back to sleeping through the night, which was worth more than four months to them.
Questions people ask
Should I stop my SIP when the market falls?
Usually not for good. In the worked example a six-month pause leaves about 97% of the projected corpus, while stopping for good leaves about 52%. If you need the cash, pause, put the money in savings, and write down the date you restart.
What happens if I pause my SIP for six months?
The six payments you skip miss their growth. For an 18-year plan at an assumed 10% a year, six ₹40,000 payments would have become about ₹13 lakh, and the plan reaches its target about four months later. Your existing units stay invested and keep growing.
Is it better to withdraw from mutual funds during a market crash?
Only if you need the money and have no cash to use first. A withdrawal sells units at a low price and removes money with the most years left to grow; ₹5 lakh taken out 18 years early costs about ₹28 lakh at the end at 10% a year.
How much cash should I keep in case of a layoff?
Enough months of essential spending to cover a job search without selling investments. Three to six months is the usual guidance, and more if your income is uncertain or a single income supports the household.
When should I change my long-term financial plan?
When something about your life has changed for good: income, a lasting cost, an expensive loan, or the age you want to stop work. A market fall or a headline is not a reason on its own; ask whether you would make the same change if markets had risen.
Did the Fed raise rates in October 2026?
No. On 28 October 2026 the Federal Reserve held its target range at 3.75–4%, by ten votes to two, after raising it by a quarter point on 16 September. The two dissenters preferred another rise.
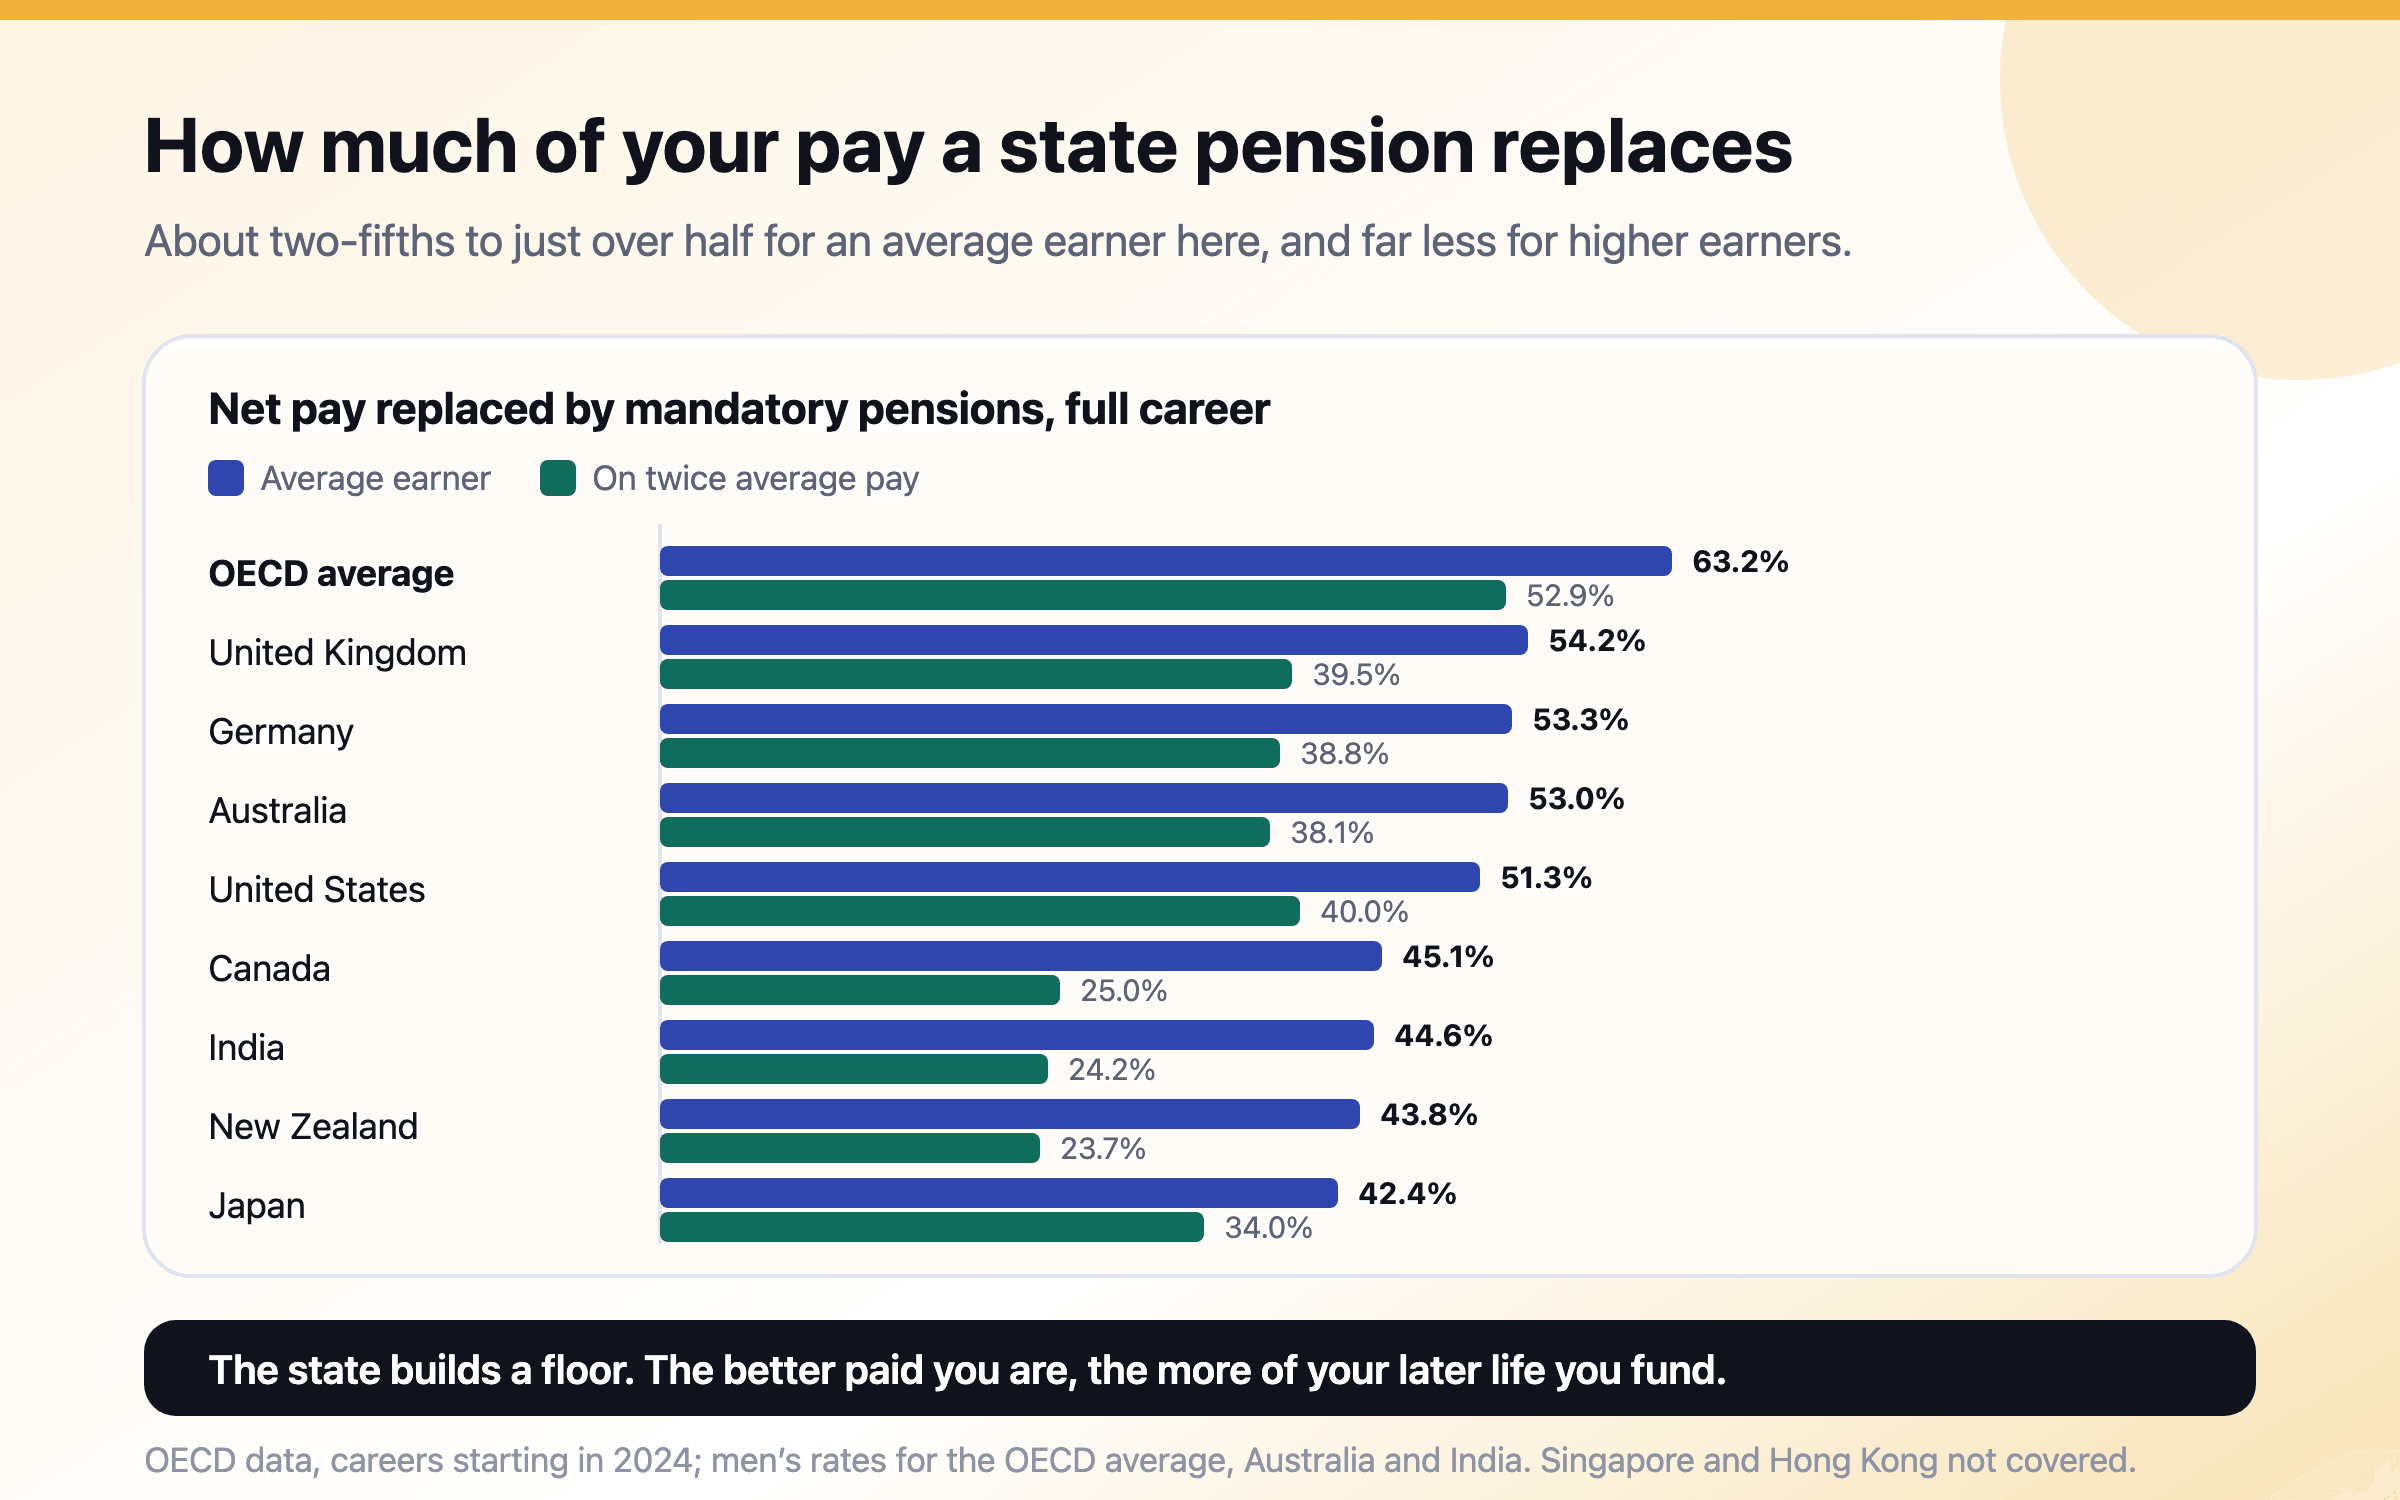
For a man on average pay, mandatory pensions replace 63.2% of net earnings on the OECD average, but around half in the US, UK, Australia and Germany and less in Canada, New Zealand, Japan and India. At twice average pay the share falls further, and Singapore, Hong Kong and India rely mostly on the worker’s own account. Here is what each system pays in 2026, how claiming age changes it, and what it leaves a middle-class household to save.
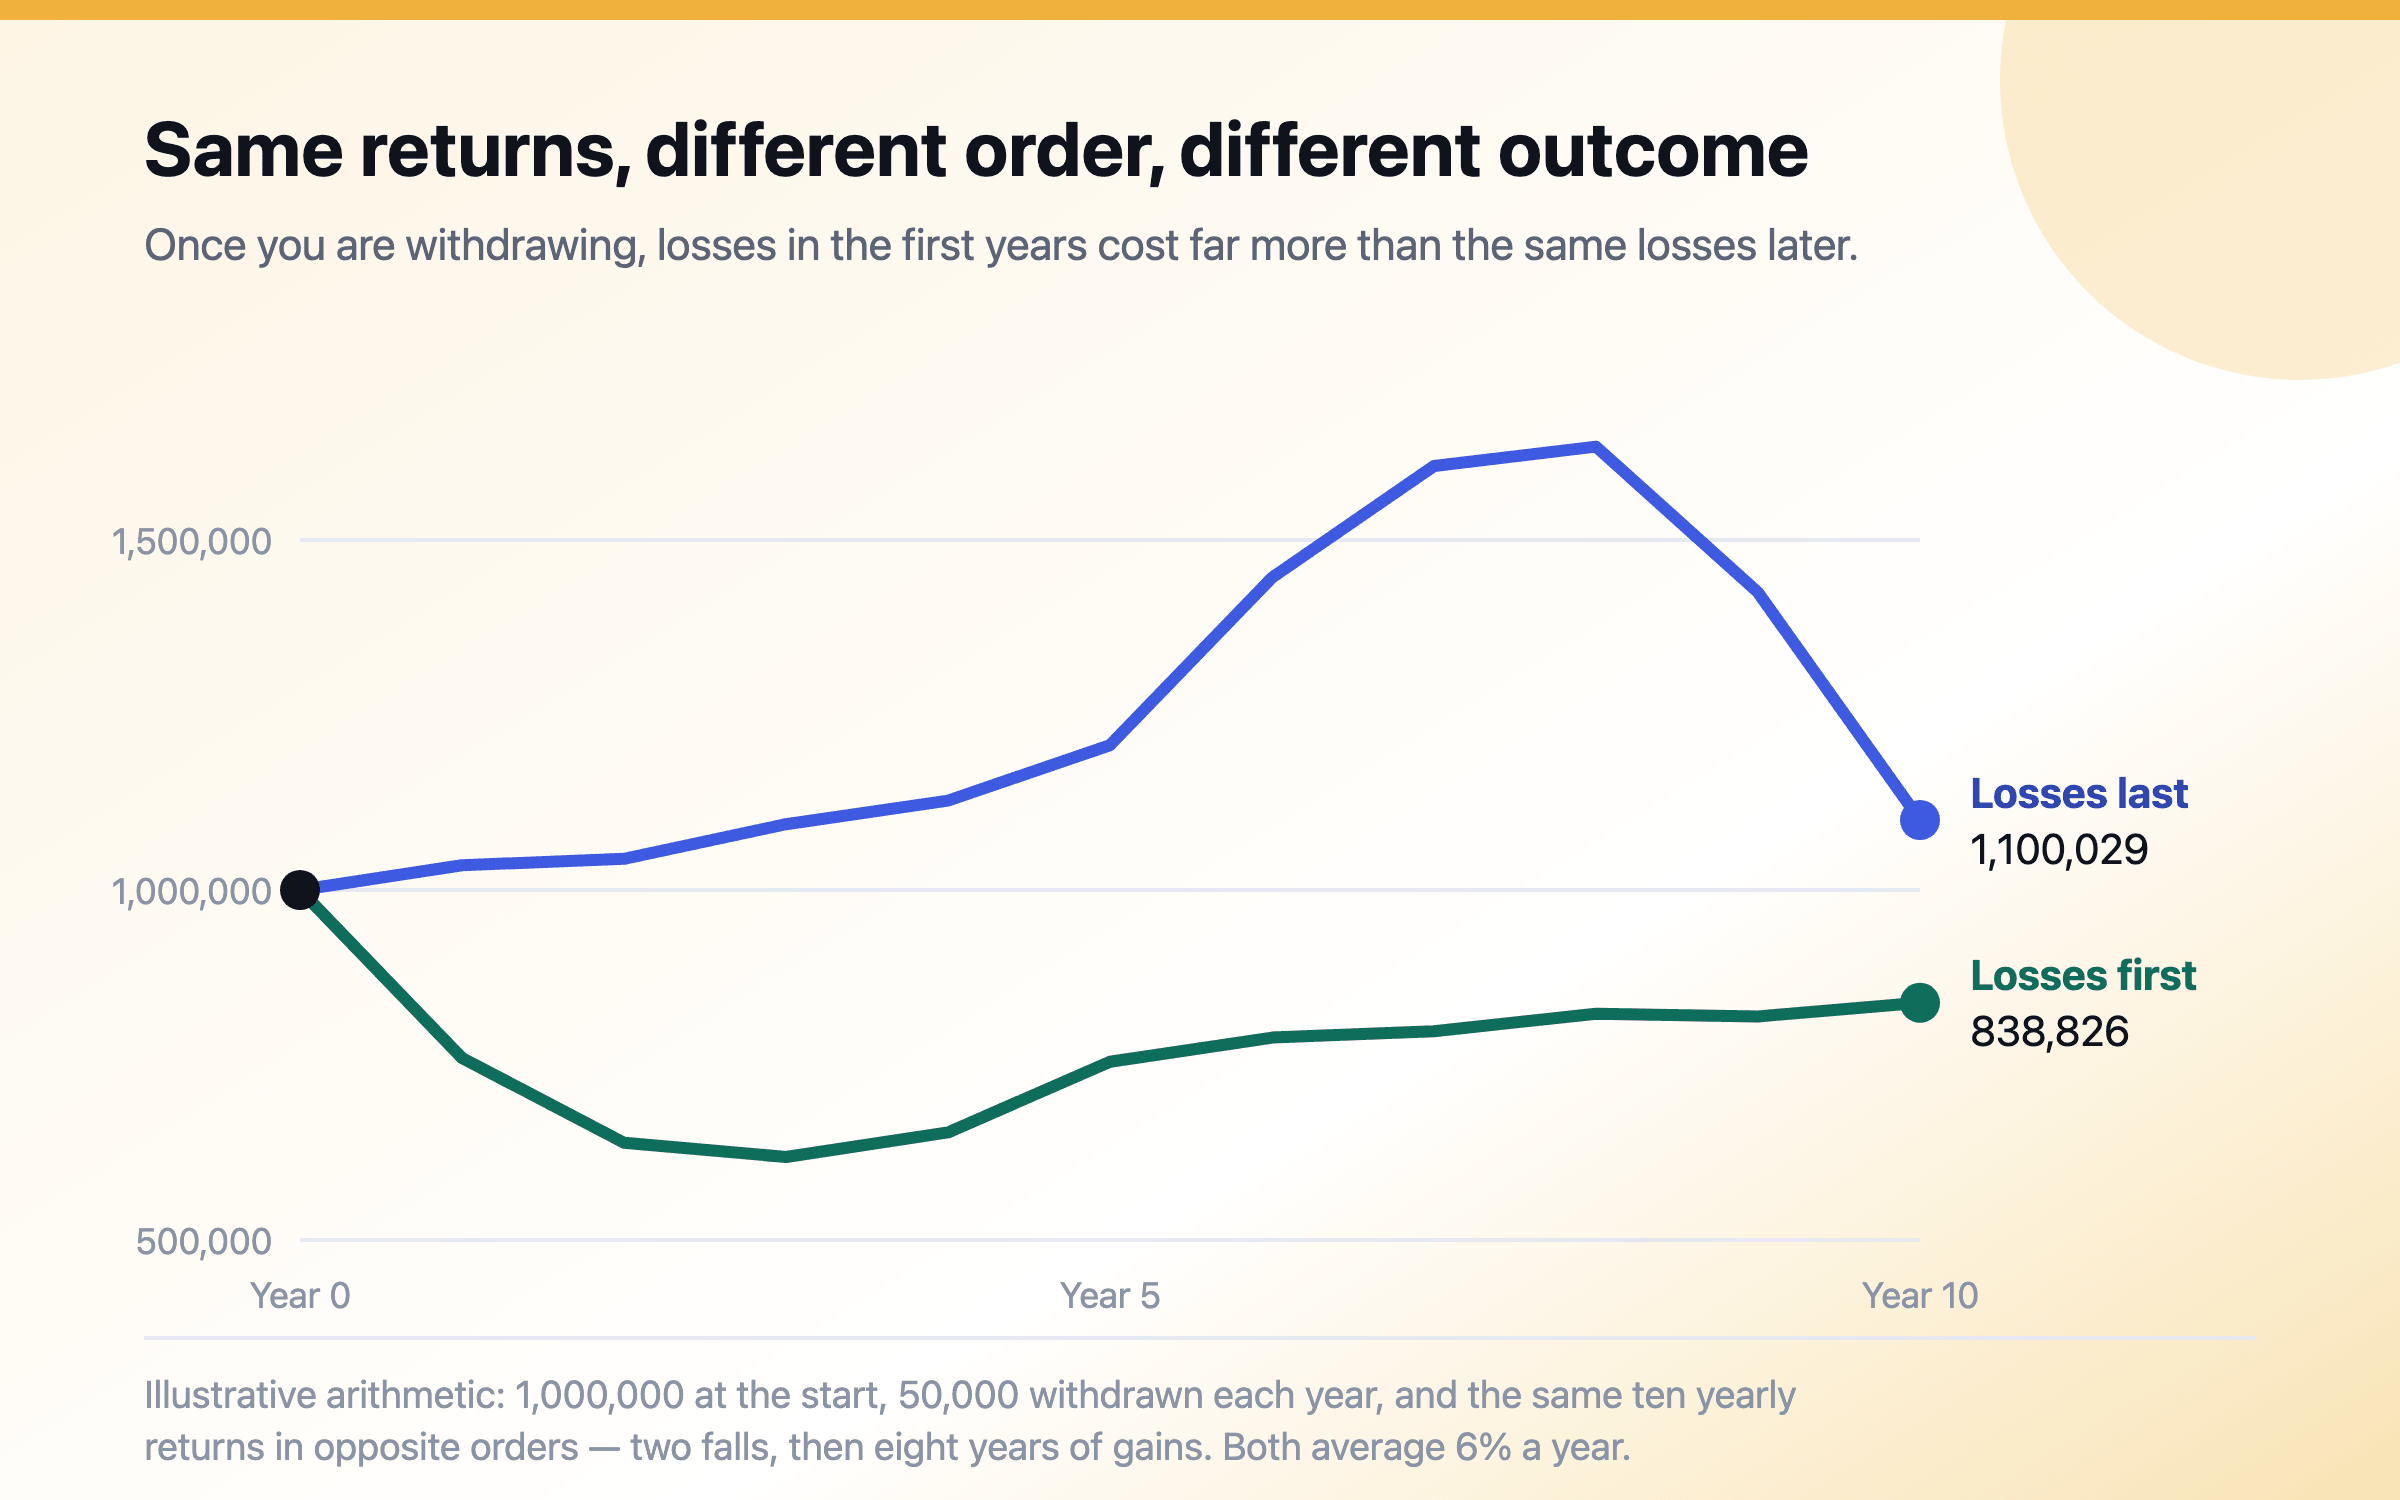
While you are saving, the order of good and bad years barely matters. Once you are withdrawing, a fall in the first few years forces you to sell low, and the money sold never recovers — so two people with the same average return can end decades apart. A cash runway, flexible spending and a modest starting withdrawal rate are the main defences.
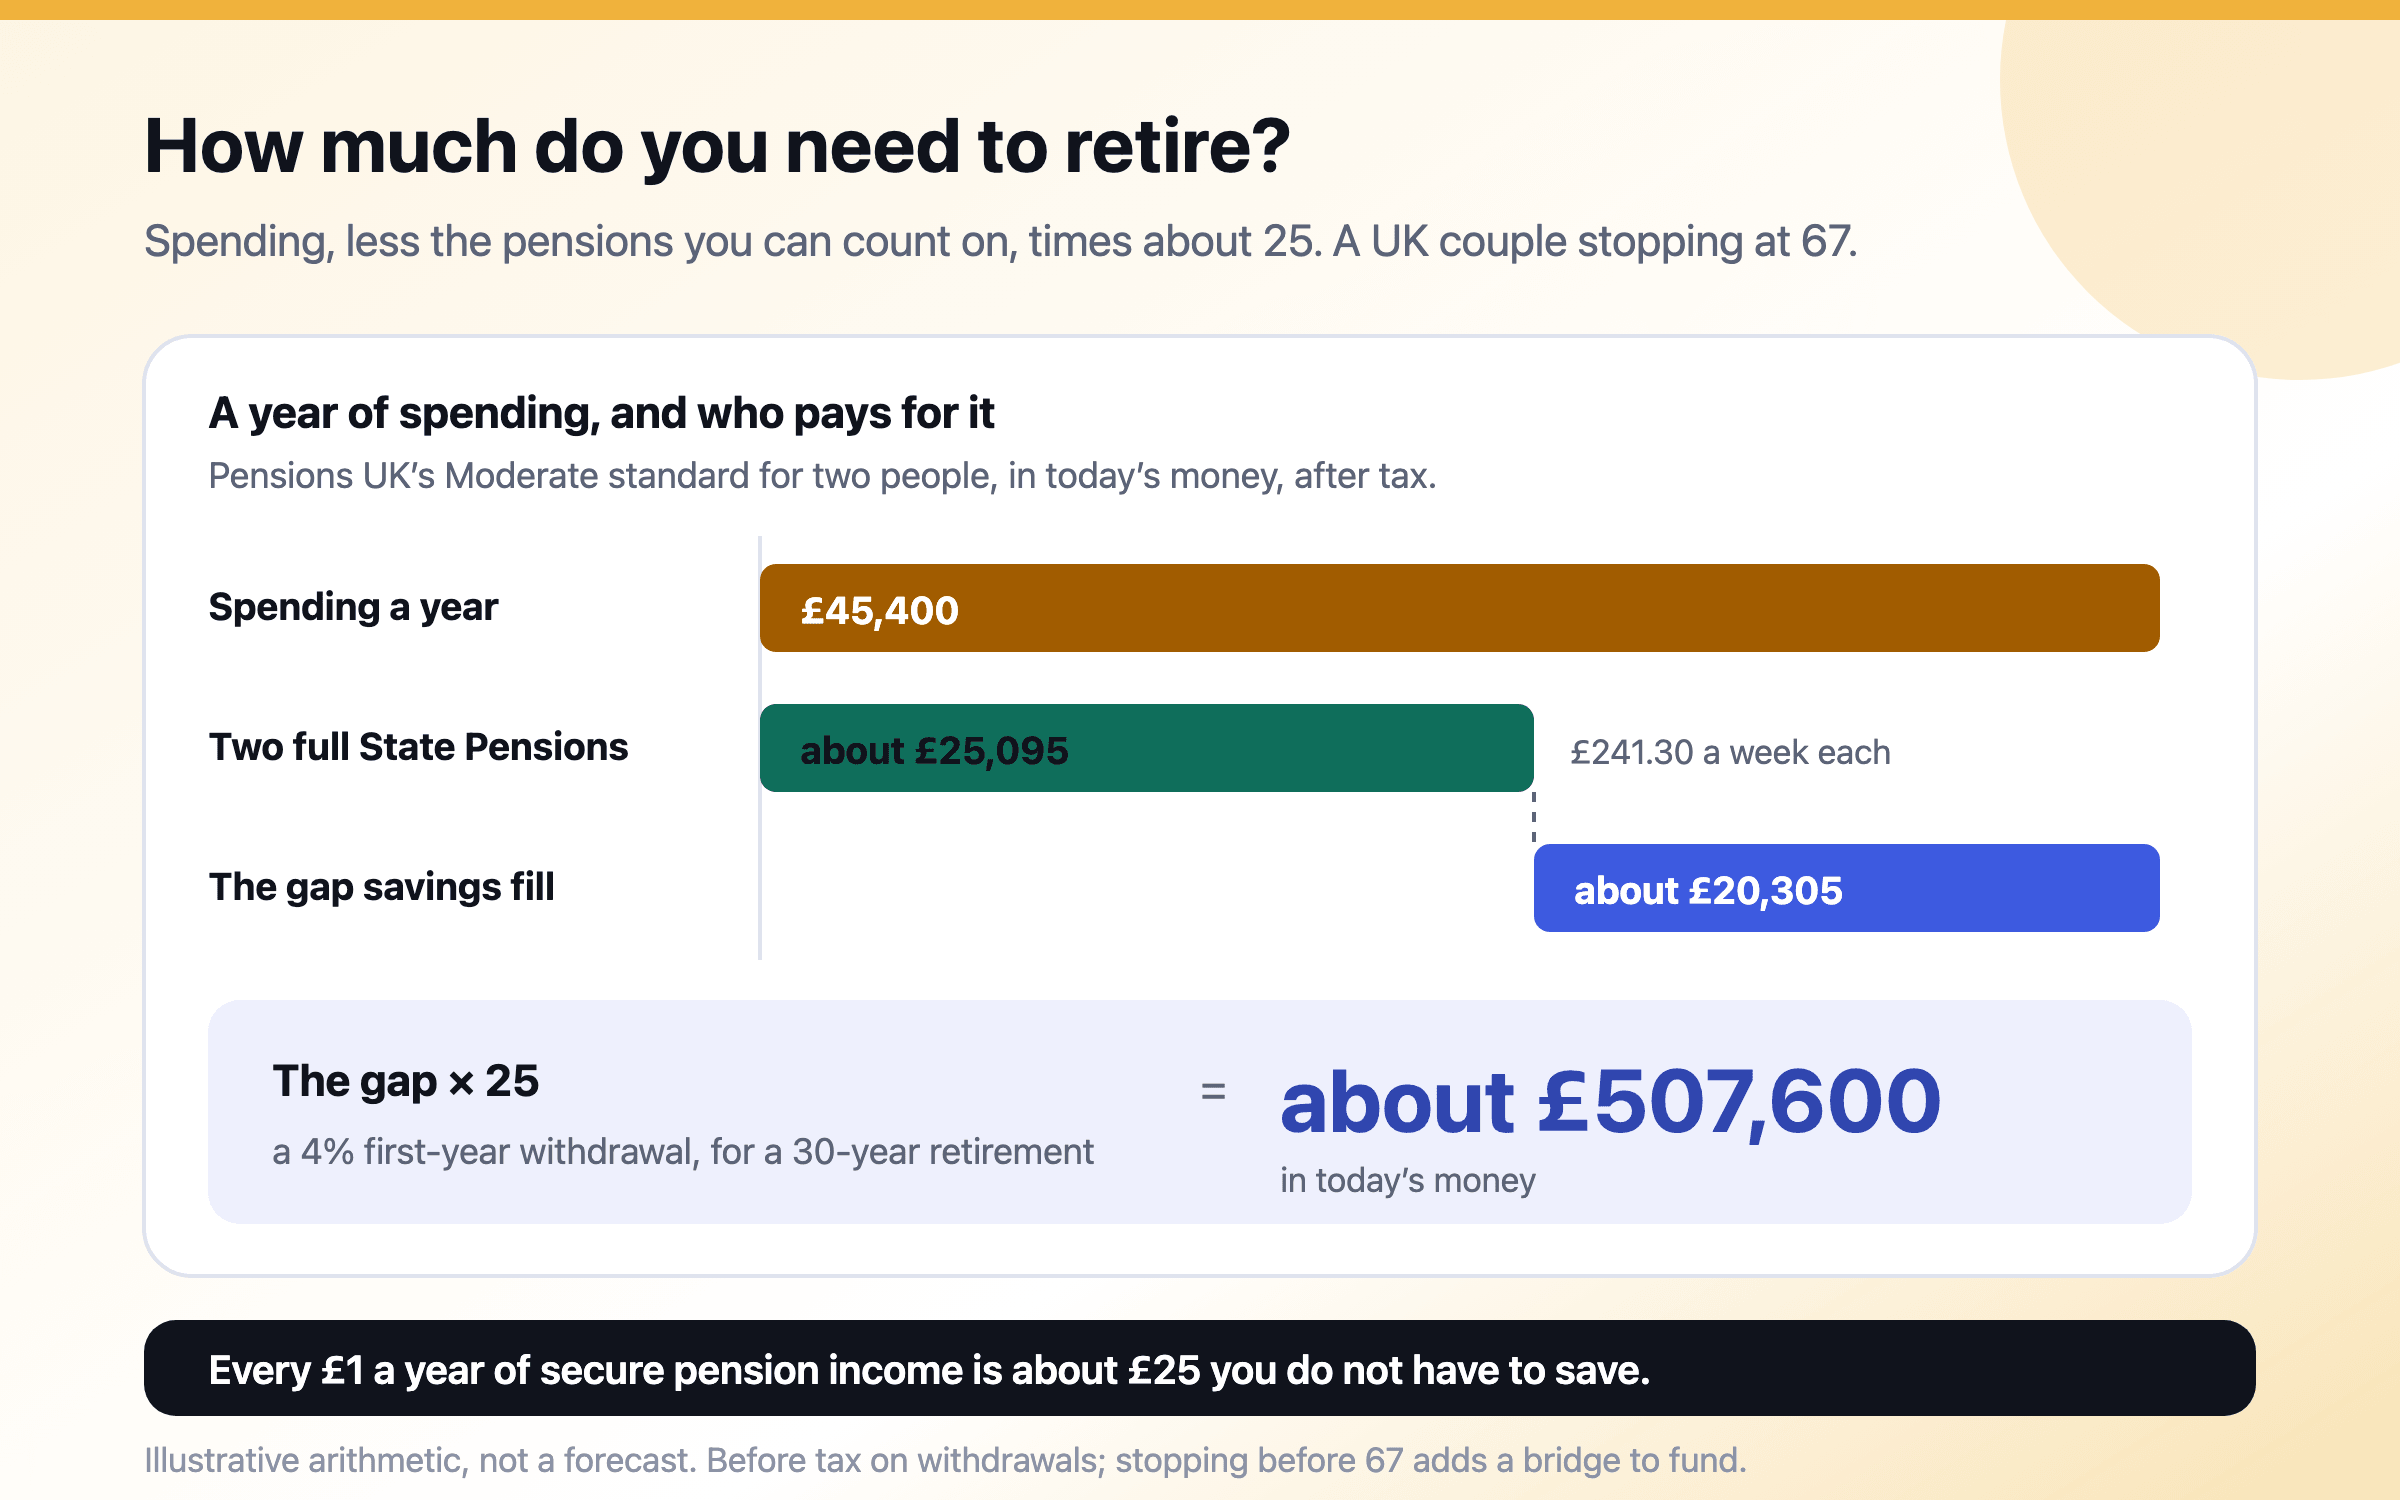
Start from what you will spend, not from what you earn. Subtract the state and workplace pensions you can rely on, and multiply what is left by about 25 for a 30-year retirement, or by closer to 30 for a 40-year one. Real spending has tended to drift down about 1% a year through retirement while healthcare rises, and a 65-year-old today can expect to live another 15 to 25 years depending on country and sex — so plan for the long end.
This is general information, not financial, tax or legal advice for your circumstances. Rules and figures change; check the official source for your country, and consult a licensed professional before making financial decisions. Projections are estimates, not predictions.